85 degree programmes


Flyer
Leibniz University Hannover Facts & Figures
PDF,
4 MB
Degree programmes


33 undergraduate degree programmes and 52 master’s degree programmes are available.
These include
- 10 degree programmes taught exclusively in English
- 4 degree programmes with majors taught in English
- 8 bilingual degree programmes
Students
Number of students per winter semester

26,079 students are enrolled in winter semester 2024/25.
Number of students in previous semesters:
- 27,229 in winter semester 2023/24
- 28,018 in winter semester 2022/23
- 28,819 in winter semester 2021/22
- 29,433 in winter semester 2020/21
Info: 25,139 students were enrolled in summer semester 2024.
Students per faculty in winter semester 2024/25
| Faculty | total | female | international |
|---|---|---|---|
| Total | 26,079 | 4 % | 15 % |
Faculty of Natural Sciences | 2,997 | 53 % | 8 % |
| Faculty of Mathematics and Physics | 1,861 | 31 % | 17 % |
| Faculty of Electrical Engineering and Computer Science | 3,095 | 16 % | 33 % |
| Faculty of Mechanical Engineering | 2,751 | 20 % | 32 % |
| Faculty of Civil Engineering and Geodetic Science | 2,109 | 31 % | 27 % |
| Faculty of Humanities | 5,774 | 65 % | 5 % |
| Faculty of Architecture and Landscape Sciences | 1,530 | 63 % | 8 % |
| Faculty of Law | 2,491 | 62 % | 4 % |
| Faculty of Economics and Management | 3,321 | 36 % | 8 % |
| Other | 149 | 53 % | 1 % |
- 44 per cent (11,377) of enrolled students are female.
- 15 per cent (3,790) are foreign nationals.
(As of winter semester 2024/25, excluding students who have taken leave of absence; full-time equivalents)
Degrees
Number of graduates per degree type


- 47 per cent (2,212) are bachelor’s degrees.
- 49 per cent (2,297) are master’s degrees.
- 4 per cent (215) are law degrees (first state examination).
(2023 academic year)
Number of completed degrees per year
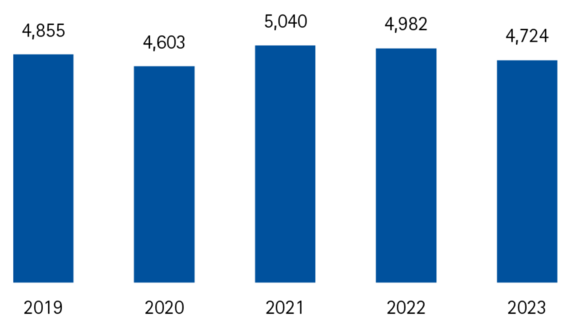


4,724 degrees were completed in the 2023 academic year. Degrees completed in previous years :
- 4,982 in the 2022 academic year
- 5,040 in the 2021 academic year
- 4,603 in the 2020 academic year
- 4,855 in the 2019 academic year
Graduates per faculty in the 2023 academic year
| Faculty | total | female | international |
|---|---|---|---|
| Total | 4,724 | 46% | 14% |
| Faculty of Natural Sciences | 568 | 59% | 6% |
| Faculty of Mathematics and Physics | 309 | 34% | 6% |
| Faculty of Electrical Engineering and Computer Science | 513 | 14% | 37% |
| Faculty of Mechanical Engineering | 711 | 13% | 34% |
| Faculty of Civil Engineering and Geodetic Science | 315 | 37% | 23% |
| Faculty of Humanities | 1,092 | 73% | 2% |
| Faculty of Architecture and Landscape Sciences | 327 | 62% | 8% |
| Faculty of Law | 230 | 65% | 4% |
| Faculty of Economics and Management | 644 | 45% | 4% |
| Other | 15 | 44% | – |
- 46 per cent (2,167) of degrees were completed by female students.
- 14 per cent (643) of degrees were completed by foreign nationals.
(2023 academic year)
Research
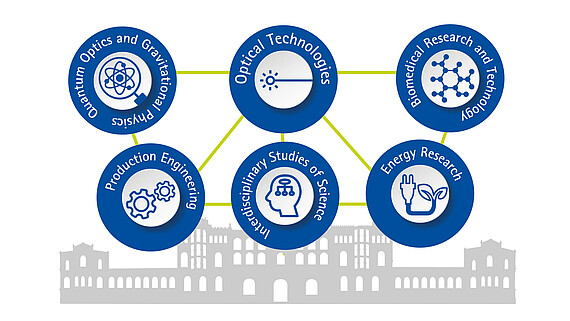

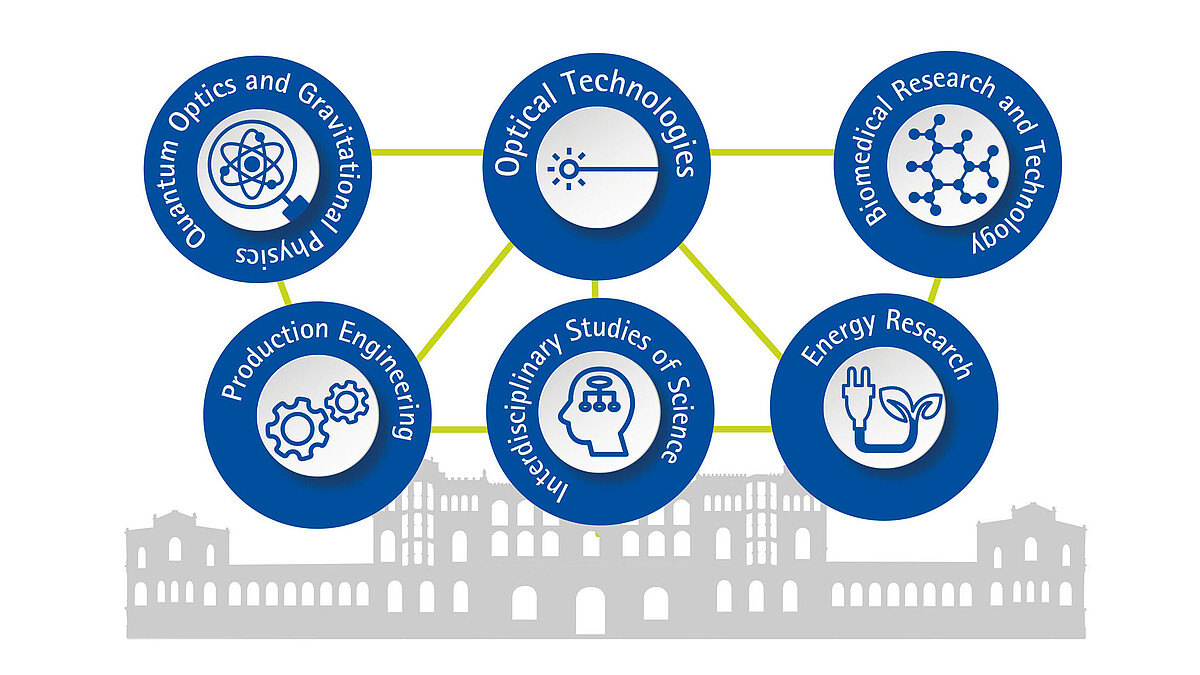
Leibniz University Hannover holds a leading international position in six key research areas.
Outstanding research projects at Leibniz University Hannover
Staff
Members of staff by gender


- 57 per cent (2,964) of staff members are male.
- 43 per cent (2,265) of staff members are female.
(As of 1 December 2023)
Number of staff per year
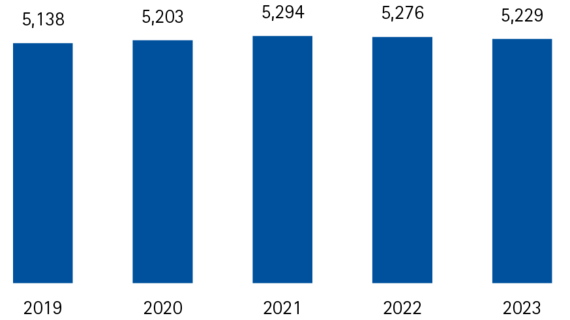
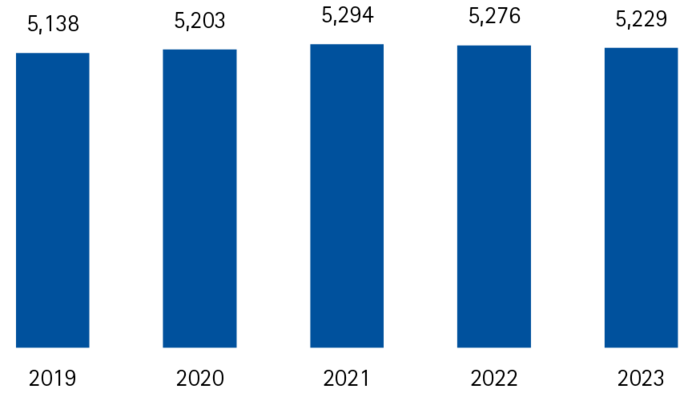

As of December 2023, the university employed 5,229 members of staff. Staff numbers in previous years:
- 5,276 in 2022
- 5,294 in 2021
- 5,203 in 2020
- 5,138 in 2019
(Numbers issued on 1 December of the respective year)
Staff per faculty
| Faculty | total | prof. | WM * | MTV * |
|---|---|---|---|---|
| Total | 5,229 | 354 | 3,029 | 1,846 |
Faculty of Natural Sciences | 648 | 61 | 399 | 188 |
| Faculty of Mathematics and Physics | 492 | 60 | 339 | 93 |
| Faculty of Electrical Engineering and Computer Science | 398 | 33 | 304 | 61 |
| Faculty of Mechanical Engineering | 742 | 22 | 476 | 244 |
| Faculty of Civil Engineering and Geodetic Science | 447 | 25 | 294 | 128 |
| Faculty of Humanities | 560 | 78 | 384 | 98 |
| Faculty of Architecture and Landscape Sciences | 210 | 31 | 140 | 39 |
| Faculty of Law | 129 | 19 | 84 | 26 |
| Faculty of Economics and Management | 232 | 25 | 170 | 37 |
| Other | 1,371 | – | 439 | 932 |
* WM = research staff; MTV = technical and administrative staff
Please note:
Unless otherwise indicated, all numbers refer to employment. Employment reflects the duties of a natural person according to the type of duties (e.g. research staff or administrative staff), the location (organisational unit) and the financing (e.g. budget funds or third-party funding). A natural person can be employed in multiple positions at the same time.
In 2023, 4,598 members of staff were employed in 5,229 positions; 1,914 (42%) of them were female and 2,684 (58%) were male. 623 (14%) were foreign nationals.
Junior researchers
Number of doctorates per faculty in 2023
| Faculty | total | female | international |
|---|---|---|---|
| Total | 372 | 31 % | 21 % |
Faculty of Natural Sciences | 82 | 44 % | 26 % |
| Faculty of Mathematics and Physics | 34 | 21 % | 26 % |
| Faculty of Electrical Engineering and Computer Science | 48 | 17 % | 33 % |
| Faculty of Mechanical Engineering | 58 | 10 % | 9 % |
| Faculty of Civil Engineering and Geodetic Science | 40 | 23 % | 38 % |
| Faculty of Humanities | 28 | 61 % | 11 % |
| Faculty of Architecture and Landscape Sciences | 8 | 60 % | 20 0% |
| Faculty of Law | 25 | 44 % | – % |
| Faculty of Economics and Management | 30 | 43 % | 13 % |
| QUEST Leibniz Research School | 19 | 26 % | 26 % |
- 117 (31 %) were completed by female students.
- 79 (21 %) were completed by foreign nationals.
Between 2020 and 2024, 45 persons completed their habilitation at Leibniz University Hannover.
- 13 (29 %) of them were female and 32 (71 %) were male.
- 9 (20 %) were foreign nationals.
Postdoctoral theses (Habilitationen) per faculty, 2020-2024
| Faculty | total | female |
|---|---|---|
| Total | 45 | 13 |
Faculty of Natural Sciences | 9 | 4 |
| Faculty of Mathematics and Physics | 8 | 2 |
| Faculty of Electrical Engineering and Computer Science | 3 | – |
| Faculty of Mechanical Engineering | 5 | – |
| Faculty of Civil Engineering and Geodetic Science | 2 | – |
| Faculty of Humanities | 12 | 5 |
| Faculty of Architecture and Landscape Sciences | – | – |
| Faculty of Law | 3 | 1 |
| Faculty of Economics and Management | 3 | 1 |
Finances
Overall income in million €

The overall income of Leibniz University Hannover in 2023 included:
- 47 per cent (296.9 million €) in state subsidies
- 12 per cent (73.1 million €) in special funds provided by the state government
- 10 per cent (63.6 million €) in other income
- 3 per cent (18.4 million €) in quality improvement funding and tuition fees for long-term students
- 28 per cent (178.8 million €) in third-party funding
(Income according to the 2023 earnings statement)
Development of third-party funding in million €

In the 2023 financial year, Leibniz University Hannover acquired 178.8 million € in third-party funding. Third-party funding in previous years:
- 176.0 million € in 2022
- 157.1 million € in 2021
- 143.2 million € in 2020
- 130.0 million € in 2019
Sources of third-party funding in million €

- 36 per cent (63.8 million €) of funding provided by the German Research Foundation (DFG) and the Volkswagen Foundation (thereunder 0.9 million €)
- 26 per cent (64.7 million €) in federal funding
- 11 per cent (19.4 million €) in other third-party funding (e.g. DAAD)
- 6 per cent (10.7 million €) of funding from commissions
- 11 per cent (20.2 million €) in EU funding
(As of 2023)
Third-party funding per faculty in 2023
| Faculty | total (million €) | incl. DFG/VW Foundation | incl. EU/federal gov. |
|---|---|---|---|
| Total | 178.8 | 36 % | 47 % |
Faculty of Natural Sciences | 14.1 | 47 % | 37 % |
| Faculty of Mathematics and Physics | 19.0 | 16 % | 79 % |
| Faculty of Electrical Engineering and Computer Science | 15.0 | 22 % | 53 % |
| Faculty of Mechanical Engineering | 47.1 | 38 % | 45 % |
| Faculty of Civil Engineering and Geodetic Science | 21.5 | 35 % | 54 % |
| Faculty of Humanities | 7.9 | 42 % | 40 % |
| Faculty of Architecture and Landscape Sciences | 2.2 | 13% | 72 % |
| Faculty of Law | 0.6 | 15% | 65 % |
| Faculty of Economics and Management | 2.4 | 46 % | 24 % |
| Leibniz School of Education | 1.9 | – | 80 % |
| QUEST Leibniz Research School | 7.1 | 90 % | 0 % |
| Leibniz School of Optics and Photonics | 7.4 | 100% | 0 % |
| L3S Research Centre | 12.7 | 17 % | 79 % |
| Central facilities / general administration | 19.8 | 24 % | 32 % |
Locations and buildings


Largest locations
- Schneiderberg 108,900 m²
- Welfengarten 75,596 m²
- Garbsen 40,801 m²
- Königsworther Platz 33,504 m²
- Herrenhausen 30,400 m²
Largest buildings
- Main building (building 1101) 21,650 m²
- External bookstack in Rethen (building 6502) 17,009 m²
- Multi-story building Appelstraße (building 3408) 14,715 m²
- Experimental hall Marienwerder (building 8901) 13,979 m²
- WMR building on Appelstraße (building 3403) 11,798 m²
(Measured data in terms of floor space NUF 1-6, as of January 2023)